Removing ELK overhead saving waste and redundant work
 Photo by Pexels.com
ELK (Elasticsearch, Logstash, and Kibana) is more or less a consensus when it comes to log aggregation and visualizing. As an open source software, it’s happily adopted by a wide range of companies in the world. Many competitors even built solutions on top of Elastic.co’s product like Coralogix, Logz.io, Loggly and also AWS itself with its ES service; all are used as a paid SAAS. There’s also a fully open source distro managed by Apache powered by community contributions.
However, when implemented locally, using the open source product, companies tend to create their pipelines between their applications and Elasticsearch. These different pipelines are usually cumbersome and much more complicated than they should due to disinformation and confusion when searching for best practices online.
There is a recommended over-robust pipeline that’s commonly known and used. While it’s not a bad thing to have resiliency and backup in mind, there’s sometimes a tendency to overcomplicate and surround a solution with redundant blocks. Thus, creating extra points of failure, latency and compute requirements.
The recommended architecture of ELK stack by Elastic usually includes: Application logs collected by → Filebeat (or another agent) which are sent to → Logstash and outputted directly to → Redis. → Another Logstash then collects from Redis, does its internal work which is usually grok commands, structuring valid JSON or applying white-labeling rules. → Logstash then pushes to Elasticsearch for further indexing and visualizing with Kibana. Here’s a drawing of the concept:
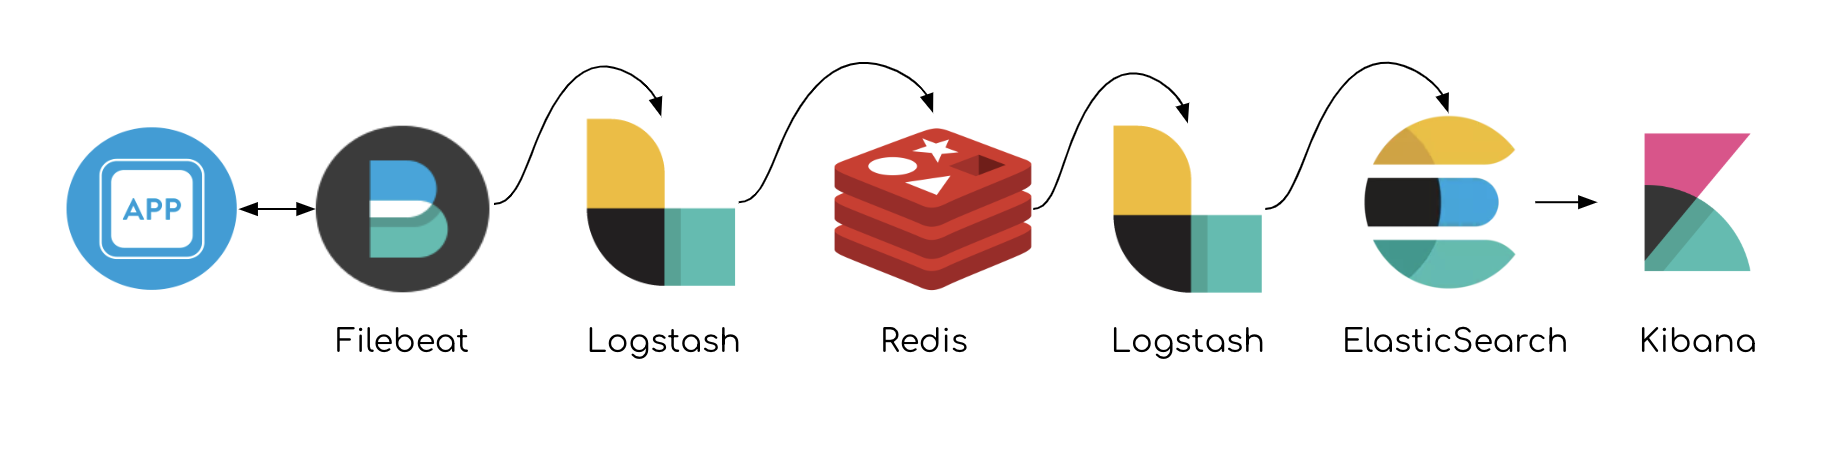 A typical ELK pipeline
The cache is used for buffer
Redis is stationed here for cache, which functions as a buffer that protects from overload or failures involving the endpoint of Elasticsearch. If Elasticsearch experiences downtime and data can’t keep flowing, Redis is stationed for Logstash to have some resilient pool to aggregate data. Usually, the sizing is computed to hold up to tens of Gigas of data with no issues until ES is restored. Having Logstash dealing with the building load on his own, it will crash nine times out of ten when ES is non-responsive.
However, in most use-cases, Redis cache can be taken out of the pipeline, without eliminating the buffer factor.
How?
When Filebeat (or Syslog / any other agent) is reading local log files, it keeps marks of the last line read and sent. When lines stop being digested, Filebeat receives a bad response and holds its marks accordingly. If the data is being sent directly to Elasticsearch, the log files are essentially functioning as the aggregation buffer!
Consider this pipeline of data: App sending valid JSON lines to file → Filebeat reads the file → FB ships to ES
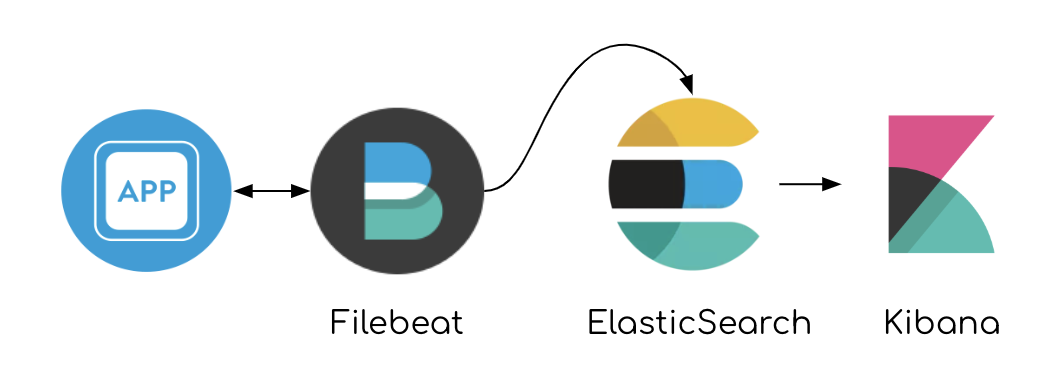 A lighter, faster pipeline
Having Filebeat agent reading files and being able to aggregate it on disk in case of failure, we can take Redis out of the equation.
How about Logstash? Well, when the application sends valid JSON log lines, there’s usually no need for any grok rules or plugins just for this end. Most commonly used logging libraries can produce JSON line upon configuration, e.g., Golang’s Logrus, Python logging, etc.
When?
Sending loglines directly to Elasticsearch is by far the most effortless setup, but it has some drawbacks;
-
There are no digestions of lines in between, which means the application needs to produce valid lines ready to be indexed a.k.a. JSON.
-
When Logstash is taken out, there’s no “grok” ruling engine of the same level to heavily-manipulate the data before indexing. Manipulation has to be done by the application before the log lines are produced, or by using Filebeat ingest mode. Another good option is using Fluentd agent for collection which has its own plugins available.
-
Buffer is capped by disk. This concept has to come into consideration when designing the flow; when ES goes down, application hosts’ disks are starting to fill up. There are numerous ways to handle this from capping the log files to emergency shipping to external storage and others.
Having that said, applying complex rules by the lightweight agents mentioned in (2.) are not a very good option as they affect the hosts. Keep that in mind when considering such work. Here’s an Elastic’s team member response when asked about the grok rules availability in Filebeat:
Beats are lightweight shippers and we try to keep it that way. Beats should do everything which is critical to be done on the edge node. For example filtering is important to reduce the number of events that are sent to reduce network traffic. If we start adding more and more processing features like grok to beats, beats will not be lightweight anymore.
A rule of thumb: a team that doesn’t need complicated data manipulations, or creates a heavy load on the logging system, can probably lose some overhead. You’ll be better off with a lighter pipeline that saves waste, risk, time and money.
It’s robust!
Setting Elasticsearch as the output for Filebeat has some pretty strong pros; It can have multiple ES hosts as an output, using round robin to distribute the load:
output.elasticsearch:
  hosts: ["10.45.3.2:9220", "10.45.3.1:9230"]
  protocol: https
  path: /elasticsearch
Moreover, if Redis restarts, data is lost in the way, while Filebeat keeps tracking the written logs from their source, protecting the flow from additional points of failure.
Filebeat also handles the pace in which data is sent:
Filebeat uses a backpressure-sensitive protocol when sending data to Logstash or Elasticsearch to account for higher volumes of data. If Logstash is busy crunching data, it lets Filebeat know to slow down its read. Once the congestion is resolved, Filebeat will build back up to its original pace and keep on shippin’.
What was achieved
The lighter pipeline takes the system down by 60% optional single-point-of-failure when cutting down 3/5 components in the way. The process speeds up by hundreds of precedents as Logstash usually takes a long time to digest the data and rewrite it (not to mention it’s frequent failures). As a direct consequence, the system is also down by a few factors in requirements for resources and compute power.
Summing it up
Yes, the recommended solution is not a magic pill; it has its cons when approaching complex data manipulations. But in my experience, for the 90% of commercial users, ELK stack works the same doing the same tedious work of slowly moving data from one component to other. Creating a single buffer, restructuring lines and eventually shipping it all to Elasticsearch.
Considering you’re statistically not in the among the 10% mentioned above and have the resources to make the required changes, I’d recommend going to for it and monitoring the results.
References
-
Architecture best practices — Elastic
My name is Omer, and I am an engineer at ProdOps — a global consultancy that delivers software in a Reliable, Secure and Simple way by adopting the DevOps culture. Let me know your thoughts in the comments below, or connect with me directly on Twitter @0merxx. Clap if you liked it, it helps me focus my future writings.